User Tools
Sidebar
This is the tutorial written by the 'triple G' group!
In this tutorial, we will explain step by step how we work on the project here
Q3. We use the example from the wiki Dispersion as a starting point and do the following:
1, Find the lines as shown in the picture below:
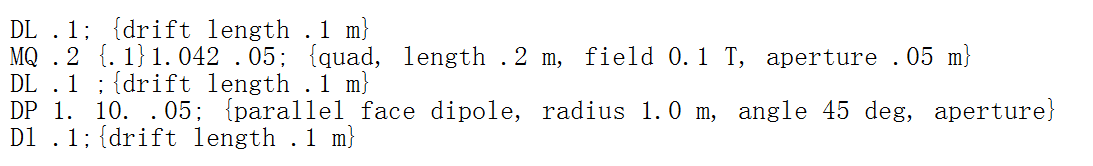
In the picture above, each of the commands (DL, DP, MQ …) represents an ion optics element. (For a complete reference of the commands used in the cosy script, one has to refer to the manual). Here in the step 3 of this project, what we want is very simple:a drift, 45-degree dipole magnet with a 1 meter bending
radius and a drift. So we modify this part of the script as shown in the picture below:

2, Run cosy and get the following output:
1.000000     0.1665335E-15 0.0000000E+00 0.0000000E+00-0.4147687     100000
0.9071068      1.000000     0.0000000E+00 0.0000000E+00-0.1881197     010000
0.0000000E+00 0.0000000E+00 0.6053100    -0.6936741     0.0000000E+00 001000
0.0000000E+00 0.0000000E+00 0.9133969     0.6053100     0.0000000E+00 000100
0.0000000E+00 0.0000000E+00 0.0000000E+00 0.0000000E+00  1.000000     000010
0.1881197     0.4147687     0.0000000E+00 0.0000000E+00 0.2260644     000001
The meanings of each number can be found in page 6 of this slides. For example, in the step 3b of this project, we need to extract the matrix elements (first order) of the horizontal positions. They are the numbers in the first column. The meanings of each matrix elements in the first column are (x|x), (x|a), (x|y), (x|b), (x|l), (x|δk). To be more specifically, for example, (x|a) represents the change of x position in the final coordinate caused by the change of a in the initial coordinate. Considering all possible factors which may change the x position in the final coordinate, the x position in the final coordinate will be:
x1 = (x|x)x0 + (x|a)a0 + (x|y)y0 + (x|b|b0 + (x|l)l0 + (x|δk)δk0
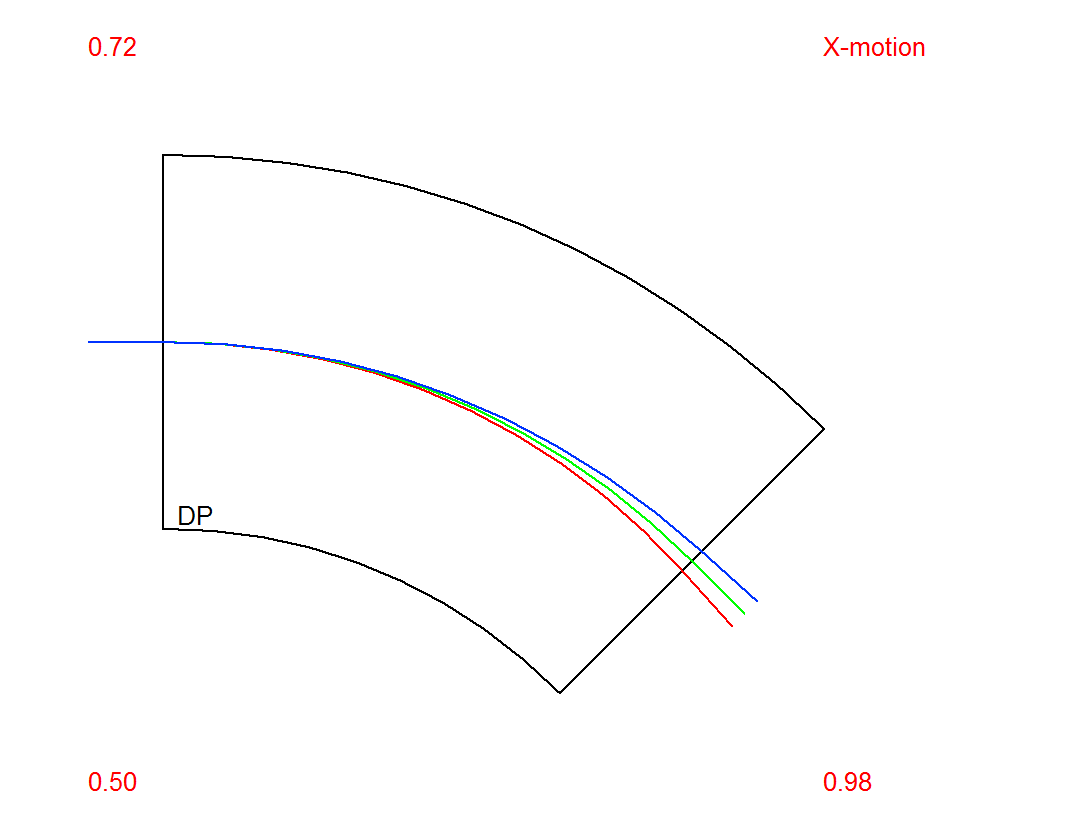
The subscript 0 means the values of the initial coordinates. The definitions of the x, a, y, b,… can be found here. If we understand the meanings of each number, we can in turn check if the numbers make sense. For example, in this case we have (x|x) = 1.0. In fact, this makes perfect sense, since we have only one dipole, if we change only the x position and keep other quantities unchanged before the dipole, we will get the same amount of change in x position after the dipole. This is because the two trajectories are parallel as shown below:
Picture to be added...
In the step 3c of this project, we need to set the beam to have some momentum spread. This is achieved by the 'SB' command. 3, Set the properties of the beam by changing the 'SB' command (in our case we set dE/E = 5%) using this command:
SB 0.0 0.0 0.0 0.0 0.0 0.0 0.0 0.025 0.0 0.0 0.0
After changing the beam energy spread, run the script again, we get the following result:
 .
Again, the result looks reasonable.
5, In step 3c, we also need to calculate with the first order matrix elements the position of ions using. This can be done by the equation that we mentioned above. We write it down here again:
.
Again, the result looks reasonable.
5, In step 3c, we also need to calculate with the first order matrix elements the position of ions using. This can be done by the equation that we mentioned above. We write it down here again:
x1 = (x|x)x0 + (x|a)a0 + (x|y)y0 + (x|b|b0 + (x|l)l0 + (x|δk)δk0
Q4.
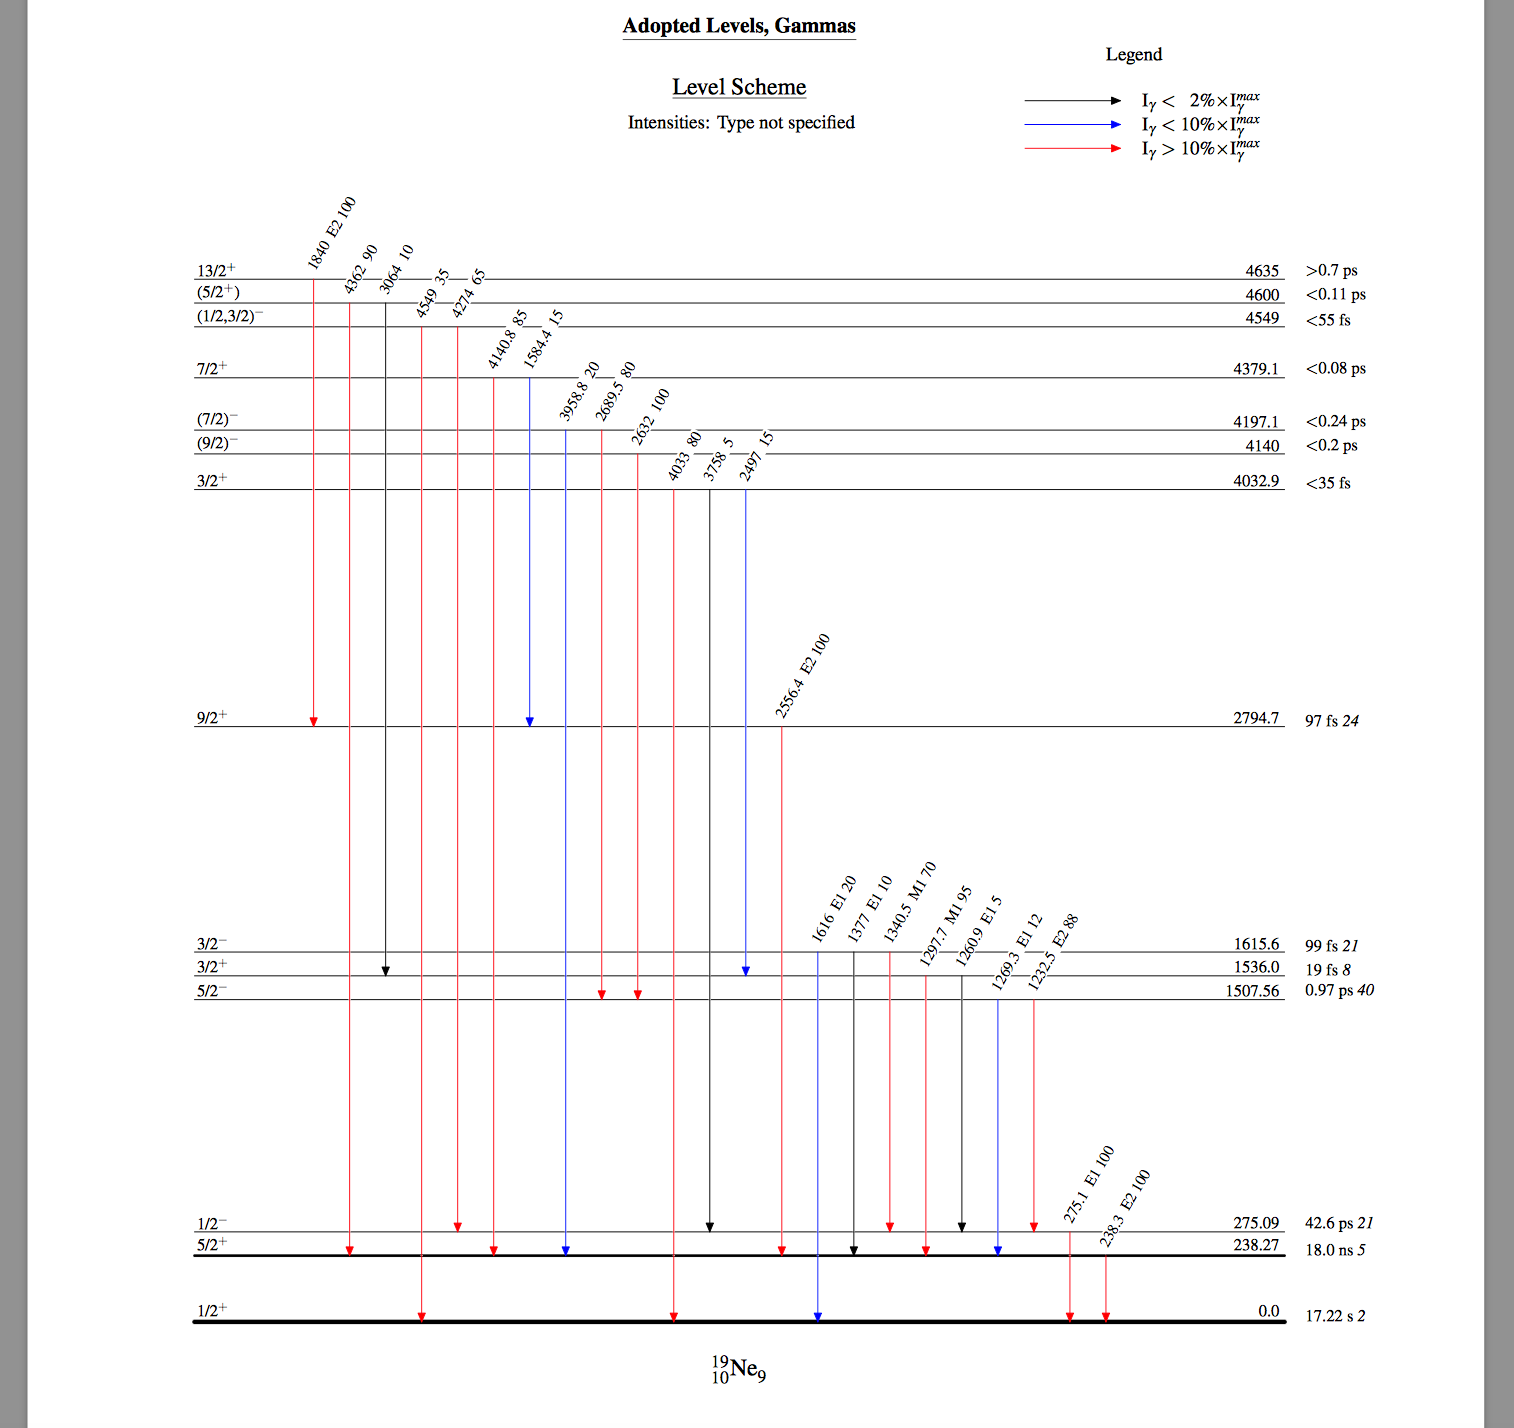
In step 4, we calculate the reaction kinematics for the 15O(a,g)19Ne (Q=3528.47MeV) reaction at 57MeV (~3MeV/u) in the lab system.
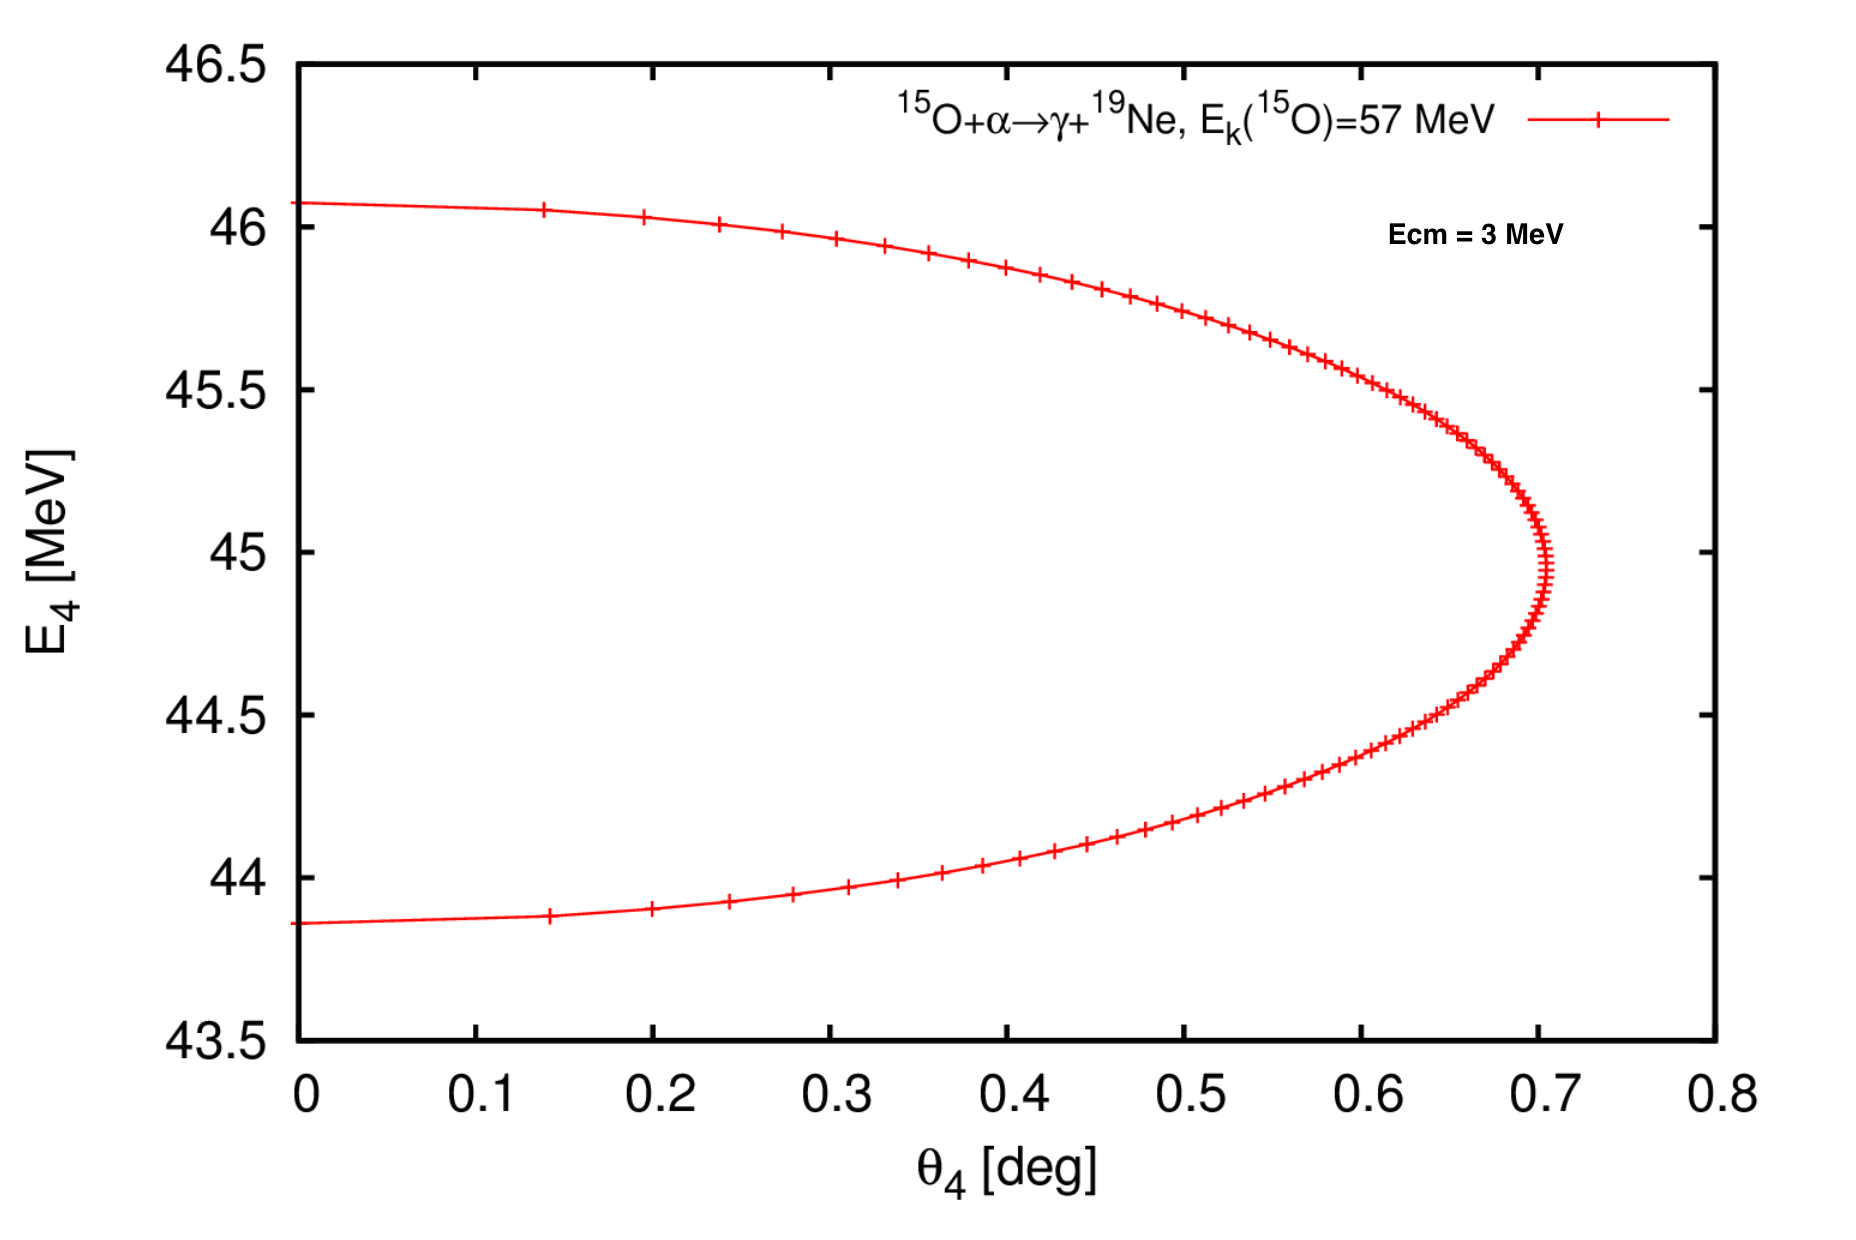
The energy spread in this case is about +-2% (maximum energy acceptance of SECAR: +-3.1%), and the angular spread is ~ +-10mrad (maximum angular acceptance of SECAR: +- 25mrad). At this energy the reaction products fit in our system without any problem.
The maximum energy that we can go until we reach the maximum energy acceptance of SECAR is ~8.2 MeV/u. For reaching the maximum angular acceptance we need energies above 20MeV/u.
* all energies are in the lab system.
Q5.
Bibliography for the 15O(p,g)19Ne reaction: http://iopscience.iop.org/article/10.1086/507083
Q6.
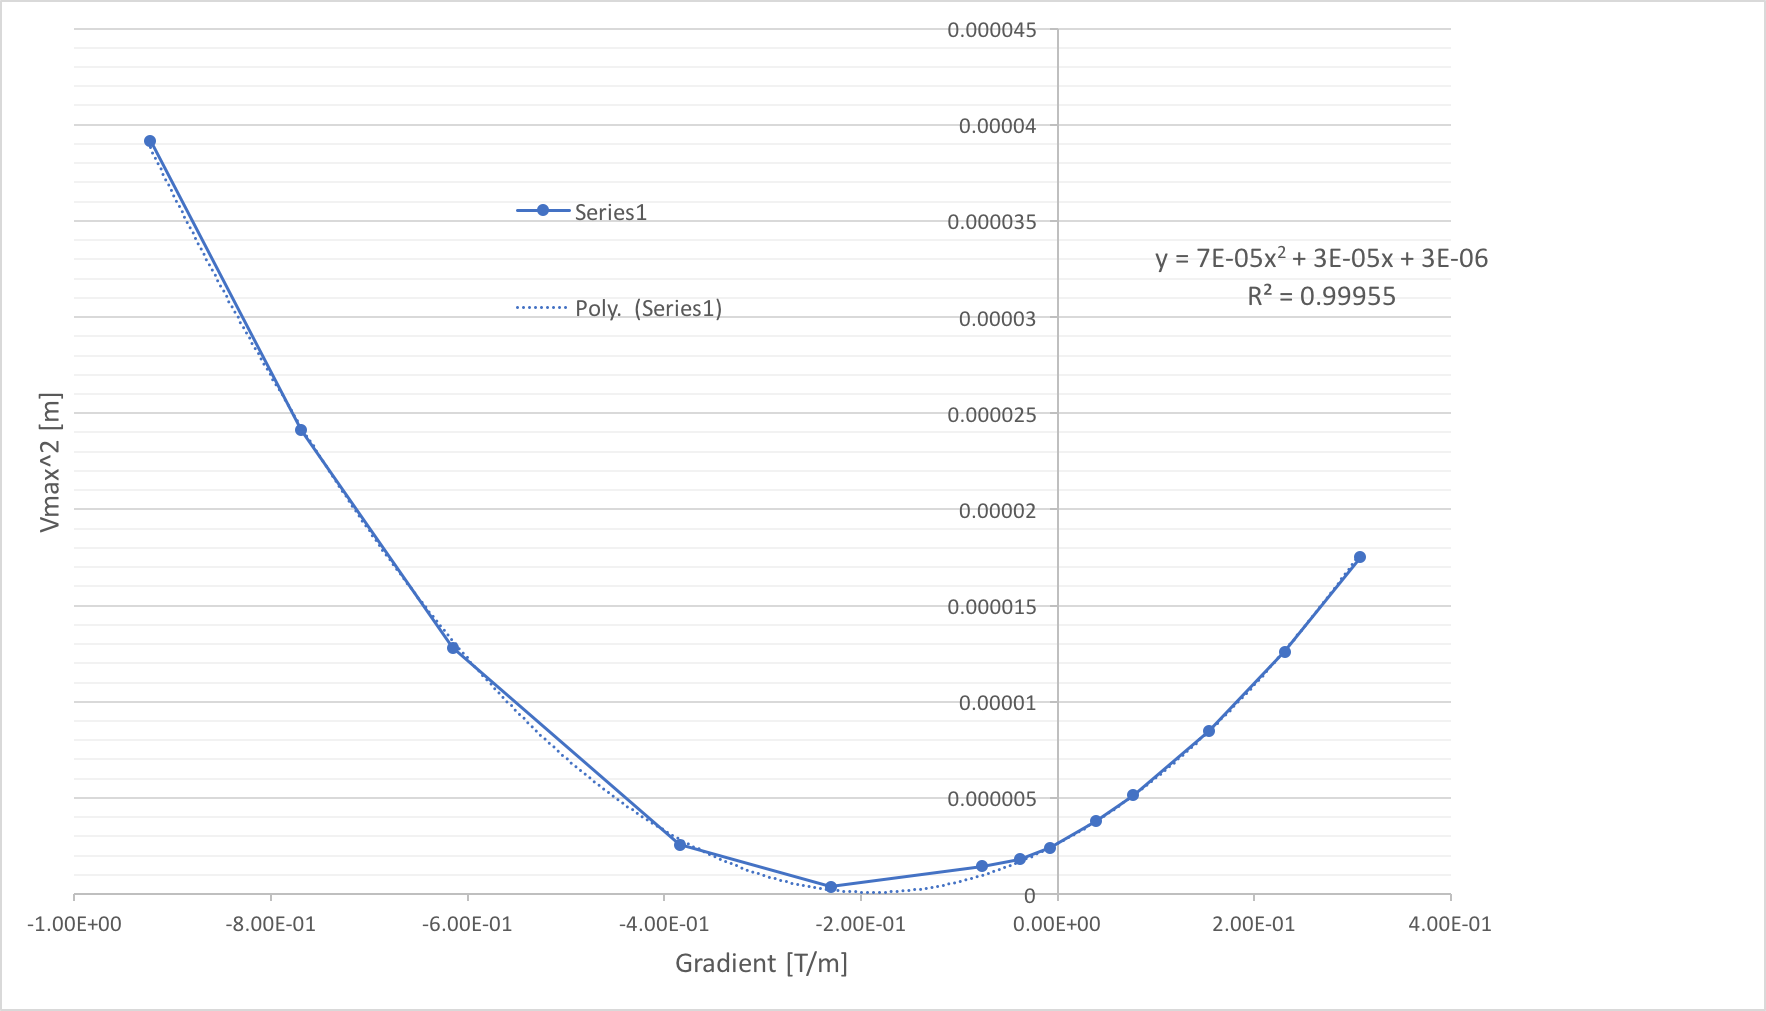
We got our data by varying the field of the quadrupole Q7 in the simplified SECAR model “emittance_script.fox” (link: download_the_tutorial_files). For getting Xmax we used the command: WRITE 6 'VMAX' VMAX(RAY(1));
For calculating the emittance we used the following equations:
s11 = P1/L^2
s12 = (P2 - 2*P1/L)/ 2*L^2
s22 = P3/L^2 - P1/L^4
where P1, P2, P3 are the fit parameters that we found (see the image above). These equations were derived using the supporting materials from here: download_the_tutorial_files
Using these equations and numbers we get:
epsilon = sqrt (s11*s22 - s12*s12) = 2.19e-7 m*rad = 0.219 mm*mrad
Correction: the equation s22 needs to be replaced by s22 = P3 -s11 -2*Ls12)/L^2
For getting the correct parabola one should plot the quantity K=Gradient*Leff/Brho on the horizontal axis.
By repeating the process using the above corrections we got: epsilon=0.47mm*mrad
By using more precise fit parameters in the calculation (excel returns rounded values) the number should go closer to 0.3mm*mrad
The nominal value of epsilon according to the “.fox” file is: epsilon=XX*AX= 0.001*0.0002 = 0.2 mm*mrad
You can perform these calculations using this spreadsheet: tripleg_emit.xlsx
Q7.
1, Change the effective length of Q2, the resolving power degraded slightly. 2, To restore the optimum resolving power, change the field strength of Q2 accordingly. We don't do it by hand, we use the FIT tookit to do that for us.
