Table of Contents
S800 Software tools
Running the S800 DAQ
This page gives user-level instructions on how to run the S800 data acquisition (DAQ) system for an experiment. Presently this is run from the linux machine u4pc8 in data-U4.
Readout GUI
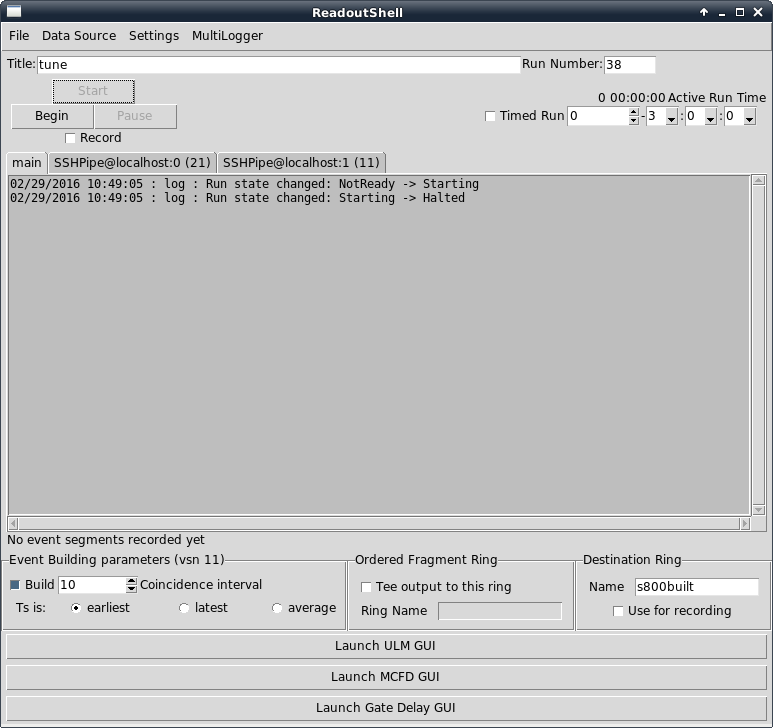
The S800 Readout GUI is invoked by either clicking the icon S800 DAQ in the desktop of u4pc8 or by navigating in a Linux terminal to the directory /user/s800/s800daq and typing godaq. The Readout GUI window will appear with three tags labeled “main”, “SSHPipe@localhost:0”, and “SSHPipe@localhost:1”. The first one provides general information about the ReadoutGUI. The second and third tabs provide information about the data sources (from the CCUSB and VMUSB controllers).
Before beginning data taking, it is necessary to initialize the system. This is done by clicking Start in the ReadoutGUI. You can inspect the status of each source during their initialization by clicking in one of the tabs “SSHPipe@localhost:0” or “SSHPipe@localhost:1”. You will see a series of messages about the different initialization steps. The last message should be “Done”. During the initialization process, a fourth tab labeled “ActionFilter” may appear with information from the S800 filter. Sometimes, you may see a warning message about an old “still-running” S800 filter session being killed. That's ok.
After initializing the controllers, the ReadoutGUI window will show the Begin button active. In addition, three additional buttons should appear at the end of the window. They can be used to start the GUI associated with the MCFD, Delay XLM, and Trigger ULM modules. Make sure that the system is completely initializing before opening those GUIs.
Before beginning a run, you have to make sure that the ULM trigger module is properly configured. This can be done by clicking the button Launch ULM GUI in the ReadoutGUI window.
The figure below shows the Readout GUI window after initializing the system. After clicking Begin, the “Event Builder” window will pop out, displaying information about the Readout session. (Note that the tab “ActionFilter” may appear if it didn't show up before, when you clicked Start.) Data can be recorded on disk by checking out the box Record. To end a data run, simply click End.
Mesytec CFD GUI
The S800 electronics includes a Mesytec CFD (MCFD), used to “filter” the detector signals going to the Scaler and Mesytec TDC. The configuration parameters of the CFD (thresholds, delays, fraction, etc.) can be remotely adjusted via a MCFD GUI developed by the NSCL DAQ group. During tuning of the S800, one typically needs to adjust thresholds only.
The MCFD GUI can be started in three different ways: 1) by clicking the button Launch MCFD GUI in Readout GUI; 2) by clicking the icon MCFD GUI in the desktop of u4pc8; 3) by navigating in a Linux terminal and typing $DAQBIN/MCFDControl16 –protocol usb –serialfile /dev/ttyUSB0. The environment variable DAQBIN is defined by sourcing the daqsetup.bash file in directory /usr/opt/nscldaq/xxxx/bin, where xxxx is the nscldaq version number (11.0-015 on Oct 26, 2015).
- To load the default CFD configuration go to Load Setting, select file MCFD16.tcl in directory /user/s800/s800daq/Configurations, and click Load
- Alternatively, it is possible to load the configuration directly from the module by clicking Update from Device.
- By default, the CFD parameters can be adjusted individually for each of the 16 channels. It is also possible to use the module in a “common” mode to set the same CFD parameters to all channels. Just check common
- After modifying any of the CFD parameters, click Commit to Device
- Don't forget to save the new settings in file MCF16.tcl.
- Go to
File - Click
Browseand select directory /user/s800/s800daq/Configurations (default) - Select file MCFD16tcl and click
Save - A warning window will pop out to verify that you want to overwrite the existing file. Answer
Yes - Click again
Save - Click
Backto return to the main GUI
- The MCFD module includes the possibility to send a periodic pulsing signal to all the channels. Two frequencies can be selected: 1.22 KHz, and 2.5 MHz
Delay Window
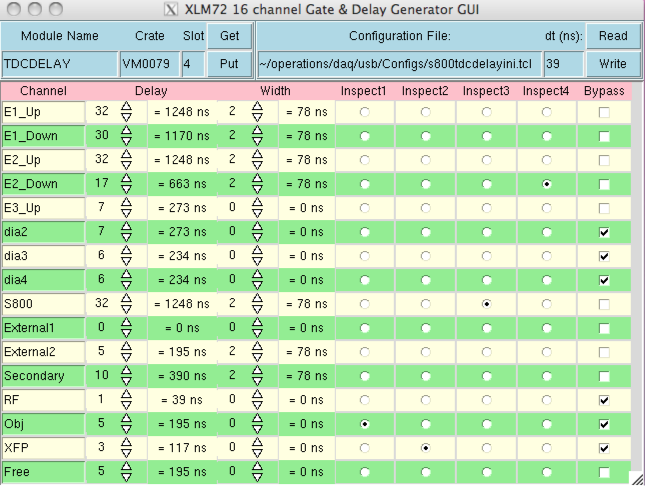
This window appears when the “Launch Gate Delay GUI” button is pressed on the Readout GUI. The delay module allows software configurable delays to be applied to each of the signals indicated in the Channel column, which then form the TDC stops. It is configurable to enable delays to be set with beam on target, as the needed delay may change depending on experimental conditions.
Some important things to remember:
- There are four “Delay Inspect” channels (routed to the patch panel in data U4) which can be selected using the Delay GUI
- These “Delay Inspect” signals can be compared with any one of the four “Trigger Inspect” channels in order to set proper delays for the TDCs. The “Trigger Inspect” channels can be selected using the ULM trigger GUI
- TDCs of last 4 listed signals (including XF (DB5) and object scintillators) are bypassed with cable delays and thus their delays cannot be controlled with the GUI. They can be inspected, however using the GUI
- It is possible to bypass the delay of a given channel by checking the “bypass” check box in the GUI
- The TDC delays can only be changed when the run control is stopped; must SAVE settings before starting run control not to overwrite adjustments being made
- The S800 trigger used as reference to calculate the ToF is from E1 up signal
- The signal delays controlled by the GUI (and not by cable delays) are not “pipelined” – i.e., any new signals that arrive during the delay time of a previous signal are lost and thus deadtime is introduced into the system. The signals delayed passively by cables are “pipelined” and thus are not subject to deadtime losses
Trigger GUI
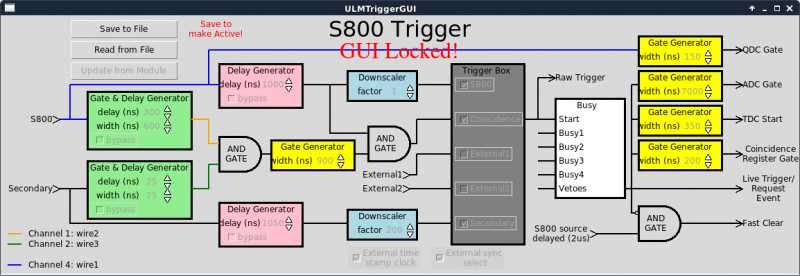
The Trigger GUI appears when the “Launch ULM GUI” button is pressed on Readout GUI. The Trigger GUI is a visual display of the various Gate and Delay Generators and logic elements that make up the configurable trigger of the S800. The logic of the trigger decision is readily discerned from a visual inspection of this GUI. Setting the trigger configuration is also done using this GUI
The different signal going through the trigger scheme can be inspected in the Data-U6 oscilloscope. Simply right click on any of the wires to put that signal onto one of the four “Trigger Inspect” channels available at the patch panel of Data-U6, and connect that patch-panel cable to the oscilloscope. By inspecting the various delays, widths and overlaps the user trigger can be configured. The Trigger GUI is discussed in greater detail here.
The Trigger (ULM) GUI allows the user to select the S800 timestamp clock: either the internally generated clock from the ULM, or an external clock from an ancillary system (e.g. GRETINA). In the latter case, you have to make sure to check the two boxes on the bottom of the Trigger GUI labeled “External timestamp clock” and “external sync select”.
Scaler Display
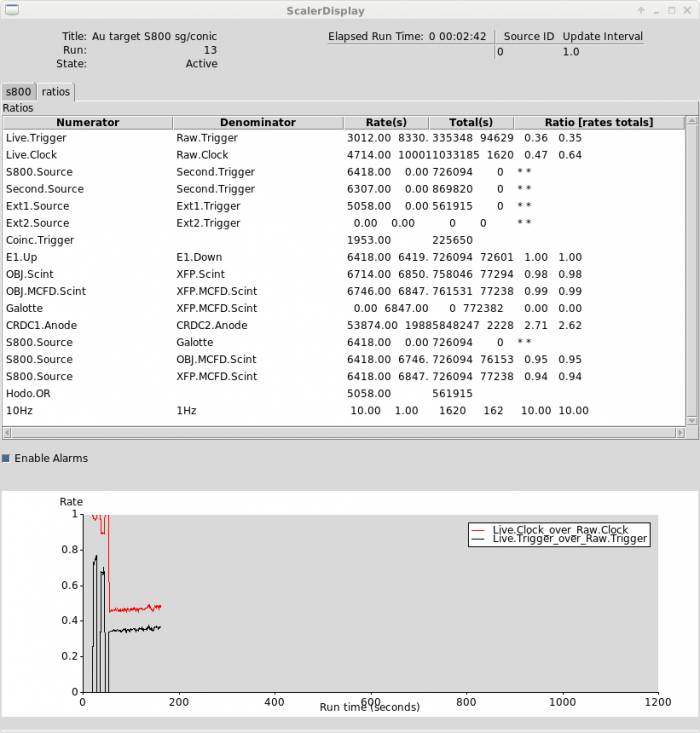
The GUI used to display scalers rates can be open from the icon S800 Scalers in the desktop of u6pc5. Alternatively, open a terminal on u6pc5, and type ./goscalers from directory /user/s800/s800daq/scalers.
The GUI includes two pages labeled “s800” and “ratios”. Page “s800” includes all the scaler channels; page “ratios” displays ratio values calculated between several pairs of channels. In addition, the GUI includes a panel showing the time evolution of the live time calculated from the live-to-raw trigger ratio, and the live-to-raw clock ratio. The figure below shows the page “ratios” from the scaler GUI.
A list of scaler channels can be found here.
Running in Slave mode with multilogger
The S800 DAQ can be run in Standalone mode (as described above), or in Slave mode. The latter means that the S800 DAQ is controlled by an external DAQ (e.g. GRETINA). In this mode, the S800 ULM receives external clock and external synchronization signals from the master DAQ. Running in Slave mode requires to change the script CC0105Begin.tcl in directory /user/s800/s800daq/Scripts. In this file, there are two variables extsynch and extclock to define if the external synchronization and clock signals are enabled (=1) or disabled (=0). Make sure that you set these variables to 1 if you want to run in Slave mode.
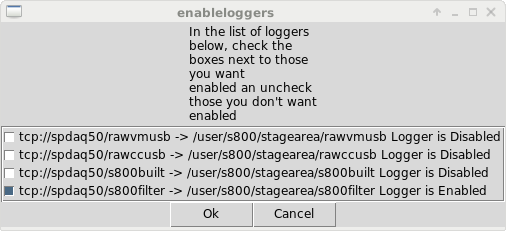
By default, when running in Slave mode, data are recorded in the stagearea of the Master DAQ (experiment account). It is however possible to record simultaneously data from the S800 into the S800 stagearea, using the multilogger option (see ReadoutGUI figure above). The S800 ReadoutGUI offers the possibility to record data from four different S800 ring-buffers: rawccusb, rawvmusb, s800built, and s800filter. The latter is the most important since data from this ring buffer can be immediately processed by the S800 SpecTcl.
When running XDT for an experiment with a Master DAQ (e.g. GRETINA), it is recommendable to run the S800 DAQ in Slave mode with the s800filter multilogger enabled. This can be done following the steps:
- Click to the tab
multiloggerin the ReadoutGUI
- Select the option “always record”
- Check out s800filter to enable recording data from this ring buffer
- After this, S800 data from every run recorded by the experimenters, will also be recorded in the S800 stagearea.
- After finishing XDT, it is better to disable the s800filter ring-buffer in the multilogger menu so the S800 stagearea doesn't record all data from the experiment.
Troubleshooting
There are several common reasons why the S800 DAQ may fail. The list below describes what to do to fix some of these problems.
Old processes still running
Sometimes, particularly if the S800 DAQ session ended in an uncontrolled way (e.g. you tried to “kill” it), there may be old processes running (CCUSB and/or VMUSB and/or S800 event builder) that will prevent Readout GUI to begin a run. Whenever this happens (typically after clicking Begin in Readout GUI), the system sends an error message complaining about one of these processes still running (for instance “Socket ID already in use”). If you find yourself in this situation try:
- Exit your Readout GUI
- On a Linux session, connect to the S800 spdaq by typing
ssh -Y s800@spdaqXX(Contact the Device Physicist to get the spdaq number XX and S800 password) - Type
ps aux | grep Readoutto ensure that Readout is indeed not running. If “Readout” is still running, usekill -9 PID, where PID identifies the Readout process ID - Type
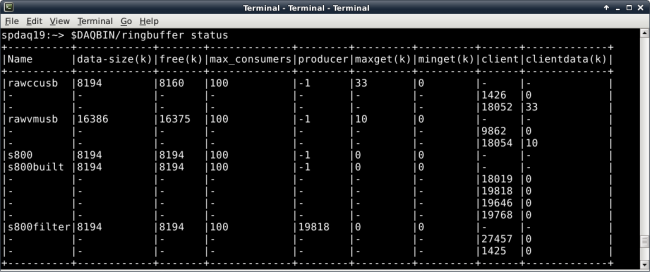
/usr/opt/nscldaq/xxxx/bin/ringbuffer status, where xxxx is the daq version, e.g. 11.0-020 - You will see a list of ringbuffers with information about their status (see figure below). Check that the producer value of each ringbuffer (see column
producer) is -1. (Don't worry about the ringbuffer s800filter, which is automatically killed when starting ReadoutGUI) - If the producer value of a ringbuffer is not -1, take note of the PID, and kill the process by typing
kill -9 PID - You should now be able to run Readout GUI and begin a run without problem
No data sources defined
When clicking Begin in the S800 Readout GUI, you get the error message: “No data sources are running so a run cannot be started”. Very likely, the setting file .settings.tcl is missing. On a Linux session in u6pc5, type ls -lisa ~/stagearea. You should see a hidden file .settings.tcl. If no, try the following:
- Go to /mnt/events/operations/s800/exxxxlast, where exxxxlast corresponds to the experiment number of the last (successfully) run experiment
- Copy the file .settings.tcl from that directory to the current stagearea. NOTE: we are assuming that the stagearea is pointing to the new experiment directory /mnt/events/operations/s800/exxxxlast
- If you cannot find that file, there is an old version that can be copied from the directory /user/s800/s800development/S800DAQ
- You should now be able to run ReadoutGUI without problem
CCUSB and/or VMUSB claimed by existing programs
One of the most common reasons why the S800 DAQ fails to start is because the CCUSB and/or VMUSB are claimed by existing programs. This is shown by the error messages displayed by the system. If you find yourself in this situation try the following:
- Log on to S800 spdaq (spdaqXX as of October 2015)
- Type
ps aux | grep Readout - Use
kill -9 PID, where PID identifies any CCUSBReadout or VMUSBReadout processes that show up - Use
kill -9 PID, where PID identifies any tclsh ReadoutShell process that might show up - Try
godaqto see if this works now - If this didn't help try rebooting the S800 DAQ manually (see below)
Manual rebooting
In the rare case that the RunControl GUI gets “frozen”, it is possible to reboot the whole system manually. This operation requires to turn off the VME and CAMAC crates, and the spdaq computer, all them located in the rack seating near the FP box in the S3 vault. Then, the system must be turned back on in the following order. First, CAMAC crate, second VME crate, and third spdaq.
For hodoscope runs, cannot read signal from hodoscope
If you see this kind error message when starting the DAQ with the hodoscope in the trigger (Ext. 1 in ULM gui), check the voltages on the crate which holds the hodoscope shaper modules. If they are not at the correct values, follow this procedure:
- Turn crate off
- Unplug both shapers (for both hodoscopes). Just pull them but don’t fully remove the cards.
- With shapers unplugged, turn crate on and check voltages
- With crate on, firmly push one of the shapers in.
- Push second shaper in
- Verify crate voltages
This procedure works for the electronic configuration with CAEN shaper modules.

