This is an old revision of the document!
Table of Contents
S800 Tuning (XDT)
This page gives the steps that are followed when tuning the S800. The two possible tuning modes are included, namely, the Focus mode and the Dispersion-matching mode.
Before proceeding, it is mandatory to complete all the steps of the to-do list necessary to prepare the S800 for tuning. The preparation of the S800 for tuning is covered by the A1900 prior to every experiment.
Focus Mode
For most of the experiments in the S800, the analysis line is run in focus mode. In this optics, the analysis line is achromatic, i.e. the dispersive position of the beam focused in the target area (pivot point) does not depend on the momentum. Thus, this mode provides the biggest momentum acceptance (4%). On the other hand, since the spectrograph focal plane is chromatic, the resolution is limited to about 1 part in 1000 in energy.
Unreacted beam
In the first part of the XDT, the rigidity of the S800 is typically set to match the value of the fragment beam (selected in the A1900) after passing through the S800 target. This is where the term “unreacted beam” comes from.
Send beam to FP
- Ensure that the S800 spectrograph magnets are tuned to the right rigidity
- Verify that the beam blocker (labeled I255 Slits) in the S3 page of Barney is open:
- Expected “open” values for top and bottom slits are CT ~6.8 and CB ~3.2, respectively
- Ensure that CRAD04 is enabled with a rate limit of 20 kHz (CRAD04 looks at E1 up FP scintillator)
- Remember: S800 FP rate limit is 6 kHz
- Bias S800 FP scintillator photomultipliers
- Set bias to best guess based on previous experience for the fragment Z being used (bias will be adjusted later during tuning)
- Typical values from previous experiments:
- For He-3 @ ~130 MeV/u: UP (1790 V); DOWN (1760 V)
- For Be-12 @ ~30 MeV/u: UP (1770 V); DOWN (1700 V)
- For Ar-34 @ ~80 MeV/u: UP (1580 V); DOWN (1510 V)
- For Zn-58 @ ~44 MeV/u: UP (1400 V); DOWN (1340 V)
- For U-238 (88+) @ ~70 MeV/u: UP (1180 V); DOWN (1280 V)
- Have a good expectation of rate from A1900 group information or from timing scintillators (typically XF_SCI: extended focal-plane detector)
- Remove stops to look for beam at S800 FP with scalers and adjust beam rate with attenuators
- Look at FP scintillator scalers (E1 up, E1 down)
- There are typically a few scaler counts without beam
Object scintillator setup
- Bias detector. Typical bias: 1200-1800 V (up to 2200 V)
- Use scope to look at signal patched out to data U6 (channel #54 in data U6 patch panel)
- This signal is sent to the CANBERRA 454 Quad CFD in data U6
- One of the output from this CFD is sent (via patch panel #62) to the TAC and scaler (channel OBJ.Scint) in S3. The other output goes through a passive delayed, and is sent (via patch panel #67) to the Phillips TDC
- Check raising time and amplitude. Good signal: ~10 ns raising time; 400-500 mV amplitude
- Using the scope, check the CFD setting:
- Check CFD walk inspect signal in scope by triggering scope with CFD output
- Ensure that CFD delay cable is ok: about 80% of raising time of the input signal
- Adjust CFD threshold looking at scalers.
- With beam on/off, check amplitude of signals from OBJ. You should be able to clearly see the difference between noise signals and fragment-beam signals.
- Raise thresholds to get rid of noise signals.
- NOTE: Be aware that sometimes, after running for a while, the OBJ box is activated. This results in a non-negligible count rate in OBJ scalers with beam off, which comes from HIGH amplitude signals (not noise). DO NOT try to eliminate this “activation” counts by raising the thresholds because that would reduce the efficiency of the detector.
- The ratio of OBJ to XFP scaler rates (channels OBJ.Scint and XFP.Scint) should reflect the transmission of the cocktail beam (between 60% to 90%, depending on quality of tunning)
- Adjust MCFD threshold:
- Using the Mesytec CFD GUI, open the configuration file MCFD16.tcl in directory /user/s800/s800daq/Configurations
- The OBJ signal feeding this module is not patched out to data U6
- The OBJ signal from MCFD module goes to the Mesytec MTDC module and scaler (channel OBJ.MCFD.Scint)
- Make sure that the threshold of the XFP MCFD channel is reasonable. Rates in scaler channels XFP.Scint and XFP.MCFD.Scint should be comparable
- Adjust MCFD OBJ threshold looking at scalers. The ratio of OBJ to XFP scaler rates (channels OBJ.MCFD.Scint and XFP.MCFD.Scint) should reflect the transmission of the cocktail beam
- Save new threshold in configuration file MCFD16.tcl
- Watch for no rate change on scaler display with a bias adjustment up or down of about 50-100 V
FP scintillator setup
- Make sure that S800 DAQ is in Slave mode and multilogger enabled to record S800 data in the s800 stagearea.
- Set trigger to “s800 trigger”
- Ensure that the trigger GUI application is ready. Otherwise, open it by clicking button
Launch ULM GUIin ReadoutGUI- Under trigger tab select s800 trigger (which is E1 up by definition)
- Deselect experiment trigger
- SAVE TO FILE
- End and Begin ReadoutGUI to assert new trigger condition
- Select Spectcl window S800_SCINT.win in directory /user/s800/s800spectcl/Windows. (NOTE: Spectra definition files can be found in directory /user/s800/s800spectcl/Definitions. A good file with useful spectra is s800xdt.tcl)
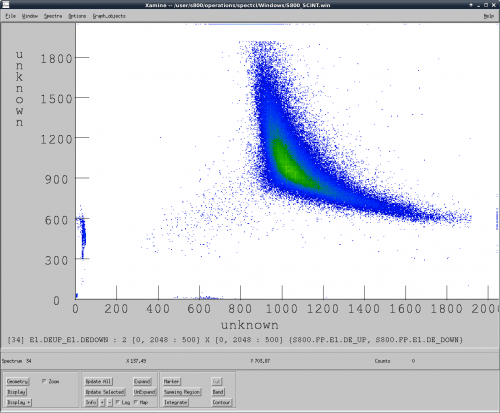
- Adjust bias looking at 2D spectra e1.deup_e1.dedown (showing the parameters s800.fp.e1.de_down vs. s800.fp.e1.de_up) for the FP E1 scintillator
- See spectrum below. Changing bias of this detector stretches the curve (i.e. shifts the blob in the middle of the curve corresponding to typical unreacted beam)
- Adjust biases so that unreacted beam are at 1/3 to 1/4 of dynamic range
- Reaction product will typically be similar enough to unreacted beam particles
- Different particles with different energy loss will shift the curve corresponding to particles covering whole FP
Ionization Chamber setup
- Gas should be flowing
- Bias detector
- Typical bias Anode: 200 V (should not draw current after bias is reached)
- Select Spectcl window S800_IC.win
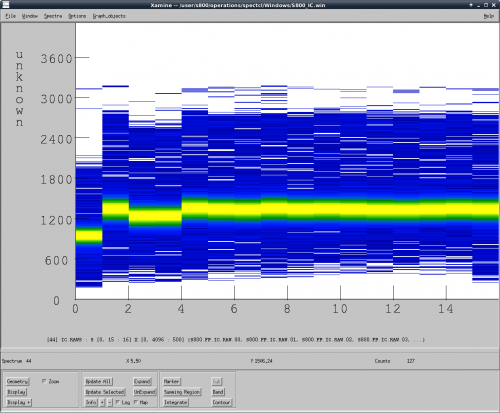
- Adjust pad gains
- There are 16 pads each providing energy-loss information in the beam direction
- The idea is to make sure the dynamic range is OK so that heavy particles do not saturate the spectra; the pad gains do not have to be matched
- Use summary 2D spectra IC.raw (see spectrum below)
- Gains are controlled in s800shpini.tcl file in directory /user/s800/s800daq/Configurations (an example of the content of this file can be seen here).
- First shaper is for ion chamber
- Typically, only coarse gains are used
- End and Begin ReadoutGUI to assert new gain values
CRDCs setup
- Bias CRDCs
- Look at anode signal on scope while biasing drift and anode
- Patched to data-U6 on labeled connector
- 200 – 500 mV signals are good
- CRDC1 anode is noisier (digital noise) than CRDC2
- Bias CRDC1 and CRDC2. Typical starting values:
- For He-3 @ ~130 MeV/u: CRDC1 (Anode=1120 V, Drift=1000 V); CRDC2 (Anode=1120 V; Drift=1000 V)
- For Be-12 @ ~30 MeV/u: CRDC1 (Anode=970 V, Drift=1000 V); CRDC2 (Anode=970 V; Drift=1000 V)
- For Ar-34 @ ~80 MeV/u: CRDC1 (Anode=860 V, Drift=1000 V); CRDC2 (Anode=840 V; Drift=1000 V)
- For Zn-58 @ ~44 MeV/u: CRDC1 (Anode=740 V, Drift=1000 V); CRDC2 (Anode=740 V; Drift=1000 V)
- For Rb-74 @ ~40 MeV/u: CRDC1 (Anode=650 V, Drift=1000 V); CRDC2 (Anode=650 V; Drift=1000 V)
- For U-238 (88+) @ ~70 MeV/u: CRDC1 (Anode=570 V, Drift=1000 V); CRDC2 (Anode=570 V; Drift=1000 V)
- Gate bias: ~20-30 V (adjust to optimize signal height compared to noise)
- Should see counts on scalers
- Count rate is a little higher than on scintillator due to noise or thresholds
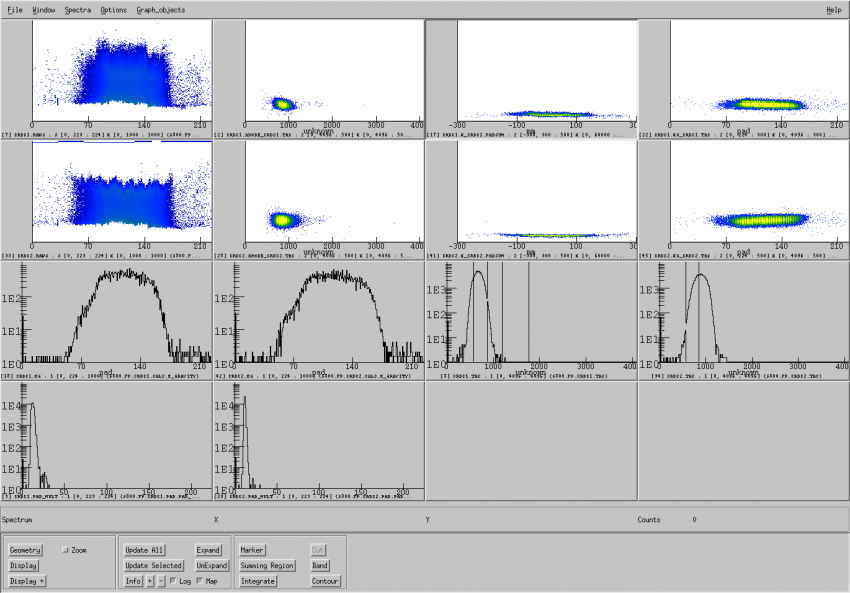
- Check Spectcl window S800_CRDCS.win (see figure below) to verify the good performance of the detectors. (The spectra for each CRDC can be checked separatelly in windows s800_CRDC1.win and S800_CRDC2.win)
- Spectra crdc1.raws and crdc2.raws
- Each spectra shows the pad signals averaged over the number of samples from the SCA (typically four)
- The 224 pads are assembled along the dispersive direction
- Width of beam peak is proportional to A1900 p-acceptance in focus optics
- Width is narrower in match optics
- Adjust anode HV to bring fuzzy maximum to around 600-700 channels (saturation of each pad at ~ 1000 ch)
- These are good spectra to check if the pad thresholds are properly set. Thresholds are too low if you see that all pads are firing at low energies. If that's the case, increase the pad thresholds in files s800crdcv1.tcl and s800crdcv2.tcl, under directory /user/s800/s800daq/Configurations (contact device physicist for assistance, if needed).
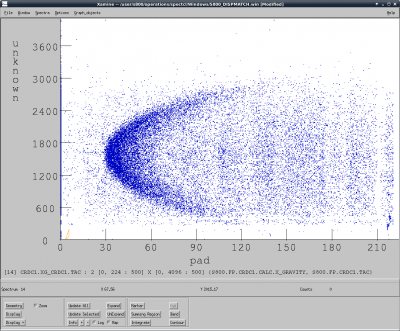
- Spectra crdc1.anode_crdc1.tac and crdc2.anode_crdc2.tac
- This spectrum is used to ensure that the field in the detectors is uniform and well aligned. If the detector is working properly, then the amplitude of the ANODE signals should not depend on the position of the beam (as shown in the figure below)
- If the field is not well aligned, then there will be a correlation between ANODE signals and TAC signals
- Spectra crdc1.x_crdc1.padsum and crdc2.x_crdc2.padsum
- It shows the sum over multiple sampled signals from each pad along the (dispersive) x position
- The padsum signals should not show any correlation with the x (dispersive) position
- Spectra crdc1.xg_crdc1.tac and crdc2.xg_crdc2.tac
- It shows the beam distribution in the dispersive (xg) vs non-dispersive (tac) directions
- It is used to ensure that the fragment beam is centered in the detectors
- It is also used to see the effect of the beam blocker (used to stop intense contaminants) in the cocktail beam
- Spectra crdc1.xg and crdc2.xg
- It shows the position of the beam in the dispersive direction, evaluated by calculating the “center of gravity”. The peak should be in the middle of the spectra in order to center the beam
- Spectra crdc1.tac and crdc2.tac
- They correspond to the non-dispersive position of the beam in the CRDCs.
- Spectra crdc1.pad_mult and crdc2.pad_mult
- They show the distribution of pad multiplicities (i.e. number of pads firing for each event). Typical average values are ~10-15. Significantly larger average multiplicities might indicate that the thresholds are set too low.
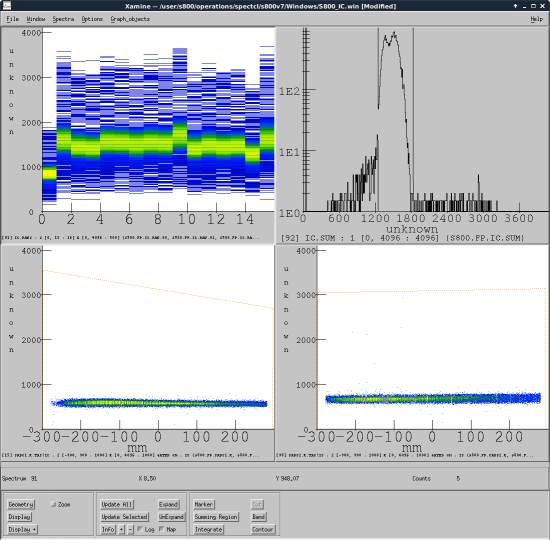
- Check Spectcl window S800_CRDCS_EFF.win (see figure below) to verify the efficiency of the detectors.
- Start a new run recording data on disk
- Make a gate in spectrum ic.sum (top right plot) to select the Z region of interest, and call it ic
- Make a summing region around the “bananas” in spectra crdc1.x.tac!ic and crdc2.x.tac!ic (bottom left and right plots respectively)
- Stop the run and rescan data from disk
- Compare the number of event inside the 2D summing regions with the number of events inside the ic gate. Typically the former are very close to the later (nearly 100% efficiency for medium/high Z)
Timing setup
At present, there are three electronic “sources” with time information for ToF calculation: ORTEC TACs, Phillips TDC, and Mesytec MTDC. Some background information can be found here.
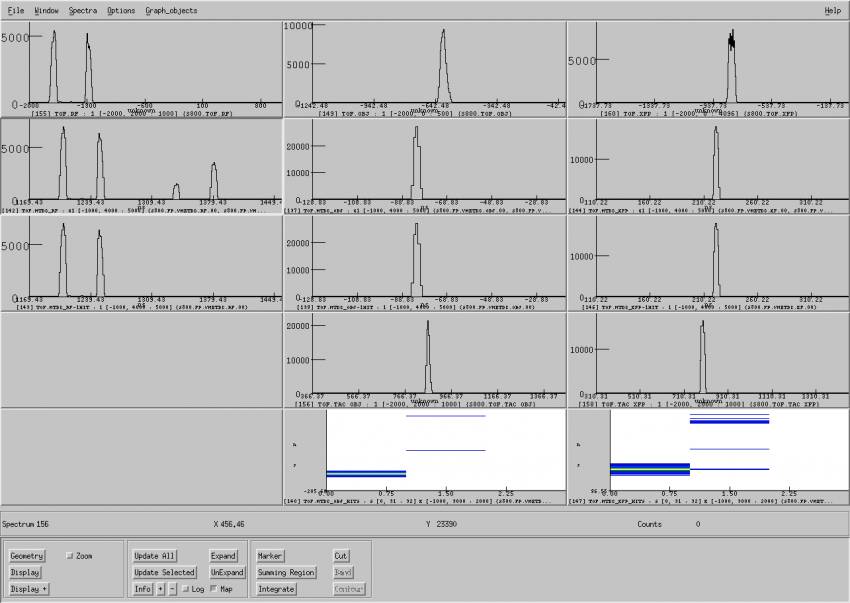
- Select SpecTcl window S800_TOF.win
- The three columns correspond to the RF-FP ToF (left), OBJ-FP (center), and XFP-FP (right)
- The first (top) row corresponds to the Phillips TDC
- The second row corresponds to the MTDC with all the hits included. Note that in a unreacted-beam setting, the first hit typically provides the “good” ToF (i.e. start and stop signals come from the same event)
- The third row corresponds to the MTDC with only the first hit
- The fourth row corresponds to the ORTEC TACs. Note that there is not RF-FP TAC
- The two spectra in the fifth row corresponds to the MTDC summary spectra of OBJ-FP and XFP-FP ToFs (zoomed in). The spectra show the ToF (vertical axis) vs. hit number (horizontal axis). Note that in a unreacted-beam setting, the first hit typically provides the “good” ToF (i.e. start and stop signals come from the same event). This is not the case in a reaction setting, where the rates in the XFP and OBJ detectors are much higher than in the FP SCI
- An empty ToF spectrum means that either the delays are not right (and need to be adjusted) or the spectrum range is too narrow
- The MTDC delays should never need to be adjusted because the matching window is sufficiently wide (around 4000 ns)
- Due to the multi-hit capability of the MTDC, we need to select the “good” MTDC ToF peak so that SpecTcl can search for the right hit (more details can be found here):
- Use the spectra TOF.MTDC_RF, TOF.MTDC_OBJ, and TOF.MTDC_XFP (second row in figure above)
- Using the cursor mouse, check the lower and higher limits defining the region in the MTDC ToF spectra with the “good” ToF peak. Do it for the three ToFs: RF-FP, OBJ-FP, and XFP-FP
- Go to the Variables page in SpecTcl GUI and assign the limits to the following variables:
- s800.fp.vmetdc.mtdc_rflow and s800.fp.vmetdc.mtdc_rfhigh for RF-XFP
- s800.fp.vmetdc.mtdc_objlow and s800.fp.vmetdc.mtdc_objhigh for OBJ-XFP
- s800.fp.vmetdc.mtdc_xfplow and s800.fp.vmetdc.mtdc_xfphigh for XFP-XFP
- For each ToF, SpecTcl will search the hit number that fits in the selected region. The new MTDC ToF parameters are s800.fp.vmetdc.mtdc_rf, s800.fp.vmetdc.mtdc_obj, and s800.fp.vmetdc.mtdc_xfp
- If necessary, adjust delays of Phillips TDC (in principle, the TACs delays don't need to be adjusted):
- Using the ULM trigger GUI assign TDC-start to one of the Inspect Trigger channels (patch panel #55 - #58) and trigger the scope with it
- Connect the XFP and/or OBJ signals going to the Phillips TDC (via cables plugged to patch #66 and #67, respectively) to the scope
- Adjust the TDC delays of OBJ and/or XFP with respect to the TDC start using the delay boxes connected to the CANBERRA CFD 454 in data U6 (~200 ns delay is good)
- Check the corresponding ToF spectra in SpecTcl to confirm that the timings are properly adjusted.
- Check the efficiencies of the Phillips TDC, TACs, and MTDC for the OBJ-FP and XFP-FP ToFs:
- Make a gate on spectrum IC.SUM selecting the region of interest, and call it “IC”
- Looking at the ToF spectra gated on “IC” compare the recorded events in the spectra with the number of events in the gate
- The window file S800_TOF_EFFICIENCY.win includes all the spectra needed
Checking Particle ID and rate at S800 FP
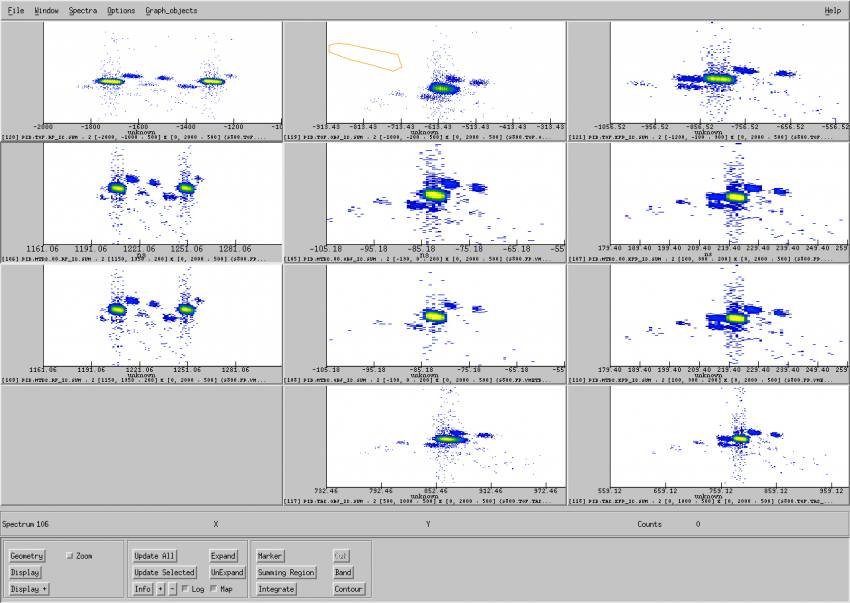
- Select SpecTcl window S800_PID.win
- The three columns correspond to the PID determined with the RF-FP ToF (left), OBJ-FP (center), and XFP-FP (right)
- The first (top) row corresponds to PID spectra using the Phillips TDC
- The second row corresponds to PID spectra using the MTDC with just the first hit included
- The third row corresponds to PID spectra using the MTDC including the correct hit corresponding to the good ToF peak (see previous section)
- The fourth row corresponds to PID spectra using the MTDC gated on the “good” ToF peak
- The fifth row corresponds to PID spectra using the ORTEC TACs. Note that there is not RF-FP TAC
- You might need to adjust the limits of the spectra to get a good resolution
- Establish PID and measure rate
- Choose your favorite PID spectrum and determine the blob that corresponds to the unreacted beam (refer to information on setting from A1900 FP). Note: the PID using the first MTDC hit might be missing good events
- Take gates around the fragment of interest
- Measure the beam intensity the appropriate faraday cup
- Take a run on disk
- Measure the beam intensity again and calculate the average value
- In SpecTcl GUI, click Attach to File and select data file run-xxxx-xx.evt in directory /user/s800/stagearea/experiment/runxxxx, where xxxx stands for the run number
- Check the run time and live time from the corresponding scaler file in directory /user/s800/converged_daq/scalers
- Calculate the rate and purity and compare with the value in the A1900 FP to determine the transmission
Analysis line classic PPAC setup (Focus optics only)
THIS SECTION IS STILL IN PROGRESS
- “Classic” PPACs are the default detector, not TPPACs or CRDCs
- Classic PPACs have rate limitations from pileups
- TPPACs are not as efficient as CRDCs for low Z because it is not currently setup to set thresholds on individual pad readouts
- Checking PPACs with beam
- Scalers do not provide reliable diagnostic information because of noise
- Bias PPACs while looking at patched out anode signal on scope to check for sparking
- Typical starting value: 400V
- A sample HV sample for 48K @ 95 MeV/u biases: PPAC1=580V, PPAC2=540V
- Look at spectra of raw up, down, left, right, anode to decide on bias
- Run with smaller p-acceptance (e.g., 0.5%)
- Efficiency against Focal plane CRDCs should be 100%
- Optimize bias setting based on raw signals
- Check that position spectra look reasonable
- Run with larger p-acceptance (e.g., 2%)
- Efficiency against Focal plane CRDCs should be 100%
- Record run showing tracking
- Confirm angular dispersion: ~50 mrad/% (not an absolute measurement)
- Confirm correlations between dispersive angle at intermediate image and p in FP (e.g., crdc1x). This correlation will be somewhat washed out by straggling in the target; in principle, this should be checked without the target, but the benefit vs. cost in time to remove the target is not worth it.
Setting Optimization
- Expectations for A1900 FP to S800 FP transmission
- 80% or better for mid-Z fragments
- >60% for low-Z fragments with large angles
- 40% transmission might be a cause for concern for high-Z beam with charge state losses in detectors/targets depending on the charge state distribution and how many charge states reach the S800 FP
- Strategy for optimizing transmission
- Want to balance losses between S800 analysis line and Transfer Hall (the S800 analysis line is typically slightly worse)
- Best diagnostic is scalers from S800 FP, object scintillator and XF scintillator
- Using the knob box and the NCS application QtKM (file BLSetup_A1900.gkm), tweak y-quads (while watching scalers) in front of dipole gaps (this works both for Transfer Hall and analysis line); choose elements that have biggest effect with smallest ratio change
- Document optimized transmission with another run to disk to measure rate of fragment of interest at S800 FP
Dispersion Matching Mode
In the dispersion-matching optics, the S800 focal point is achromatic, i.e. the position of the beam in the dispersive direction does not depend on the momentum. As a consequence, the beam is momentum-dispersed on the target area (pivot point) with a dispersion of about 10 cm/%. The main goal of the tuning is to ensure that the position and angle dispersion are cancelled at the focal plane, thus maximizing the resolution at that point. We also want a good image in the object position, which will also contribute to increase the resolution at the focal plane.
Charge-exchange experiments require typically this optics. In some cases, the beam used is 3H, which has a rather high rigidity (around 4.8 Tm). This imposes a serious constrain, because the maximum rigidity of the spectrograph is 4 Tm. Thus, in this case, the tuning of the S800 is done with 3He, produced with a CH2 target.
- Set trigger to “s800 trigger”
- Ensure that the trigger GUI application is ready. Otherwise, open it by clicking
Launch ULM GUIon Readout GUI in the desktop of u6pc5 computer - Under trigger tab select s800 trigger (which is E1 up by definition)
- Deselect experiment trigger
- SAVE TO FILE
- Begin a new run on Readout GUI to assert new trigger condition
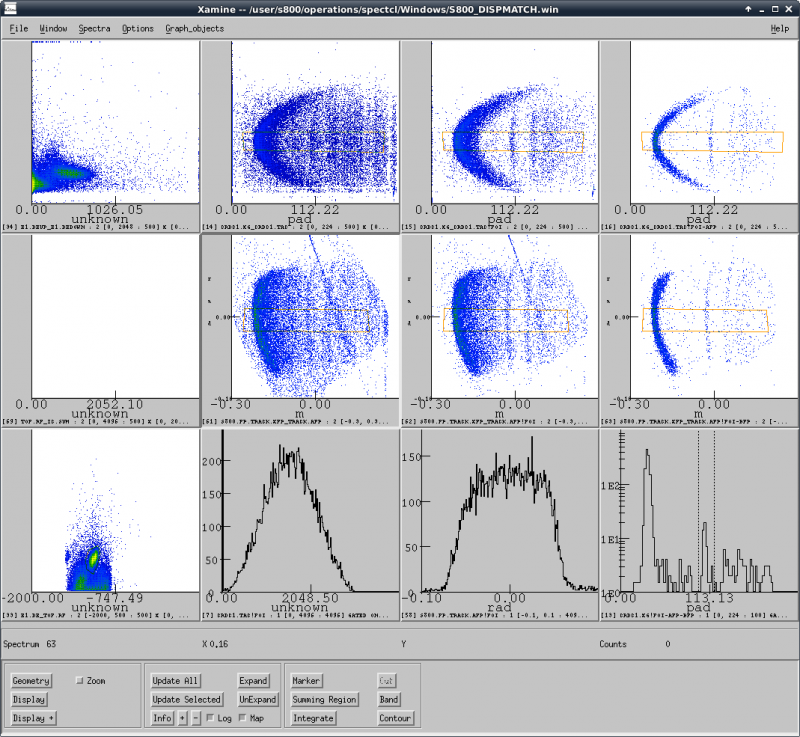
- Select Spectcl window S800_DISPMATCH.win
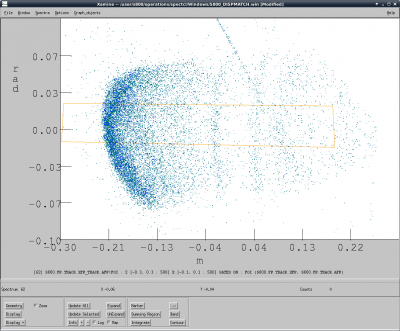
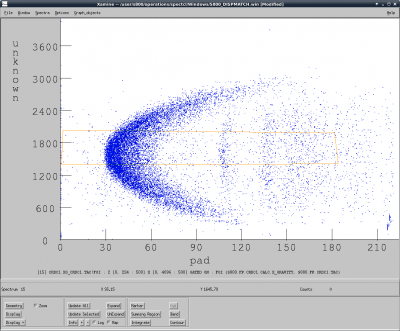
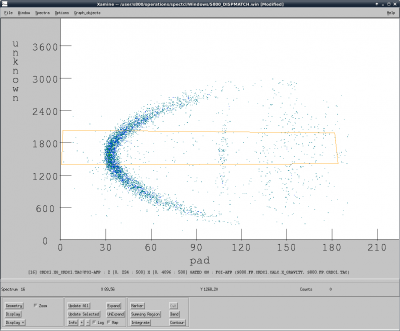
- We need to start checking the spectra showing the correlations between angle and position in both dispersive and non-dispersive directions. We typically use the spectrum CRDC1.XG_CRDC1.TAC for the non-dispersive direction, and S800.FP.TRACK.XFP_TRACK.AFP for the dispersive direction
- The parabolas seen in the above spectra correspond to reactions with H in the target. The blurred lines on the right of the parabolas correspond to reaction with C. It is hard to see clearly this lines, so we need to make several gates
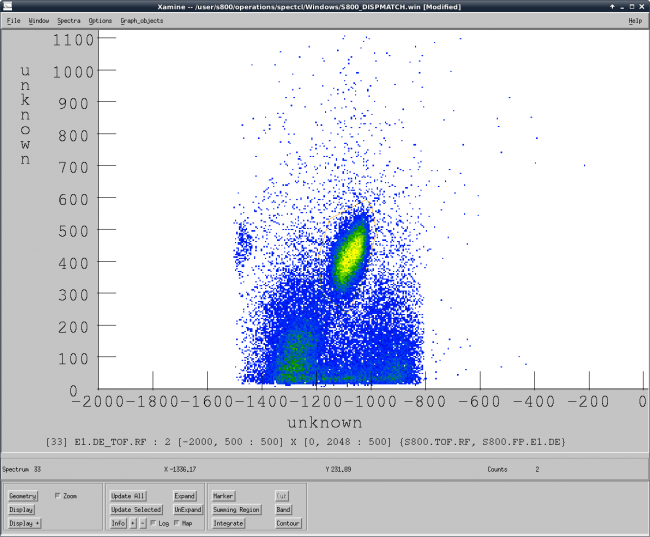
- Open spectrum E1.DE_TOF.RF and define a gate around 3He, and call it foi (Fragment Of Interest). (Note that unlike other experiments, where the energy loss is measured by the IC, we use here the E1 sinctillator.
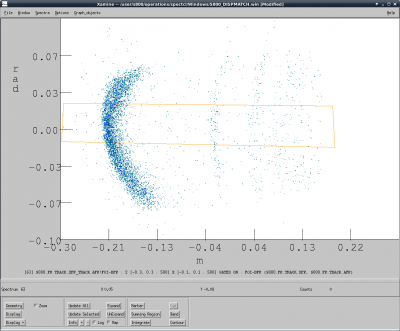
- This gate is used to fill spectra S800.FP.TRACK.XFP_TRACK.AFP!FOI and CRDC1.XG_CRDC1.TAC!FOI. As can be seen in the figures below, this gate “cleans” the spectra significantly. Indeed, one can now see the lines from reaction with C; the leftmost one corresponds to the ground-state, the next one to the right is the first excited state
- Define rectangular gates in this spectra, making sure that it is narrow enough to select a vertical section of the parabolas, but wide enough to get enough statistics. Call them afp (in spectrum CRDC1.XG_CRDC1.TAC!FOI) and bfp (in spectrum S800.FP.TRACK.XFP_TRACK.AFP!FOI). After applying these new gates, the kinematics spectra are very clean
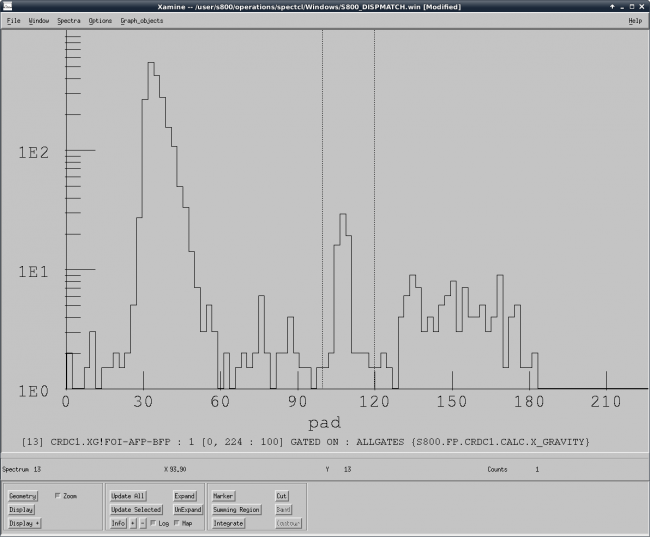
- The pre-defined gate allgates is made by the AND condition of all the gates defined above (foi, afp, and bfp). This gate is used to fill the spectrum CRDC1.XG!FOI-AFP-BFP, which will be our diagnostics tool
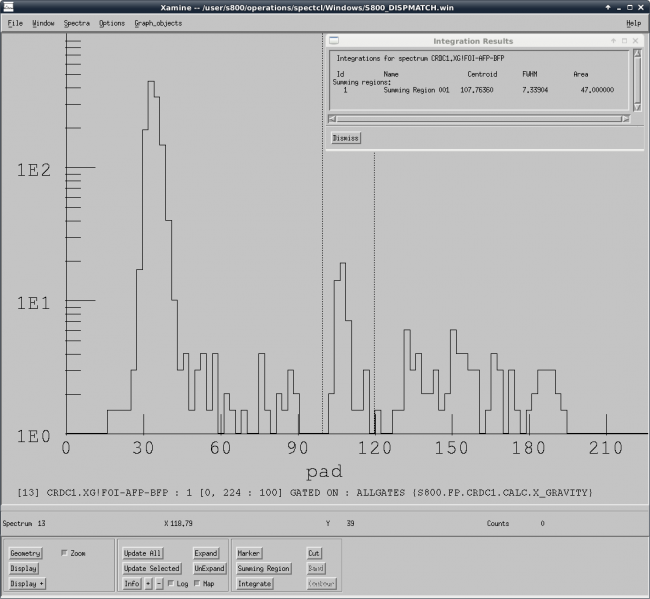
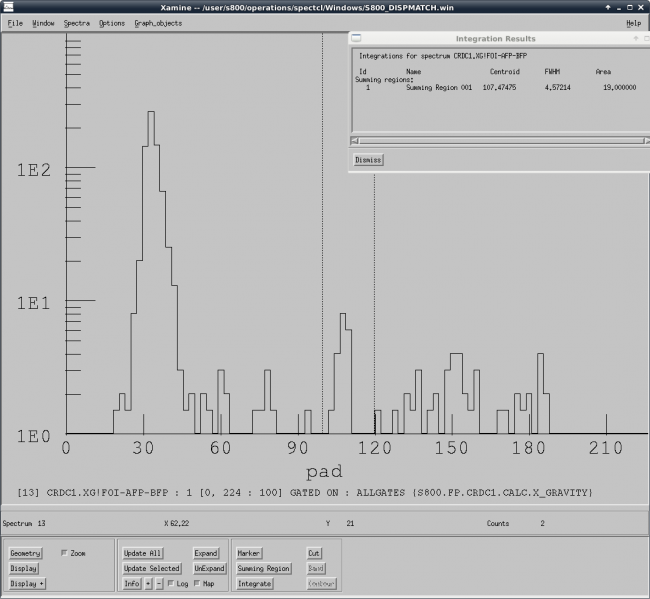
- The leftmost peak corresponds to reactions with H. The central peak are reaction with C. The goal of the tweak is to make these peaks as narrow as possible
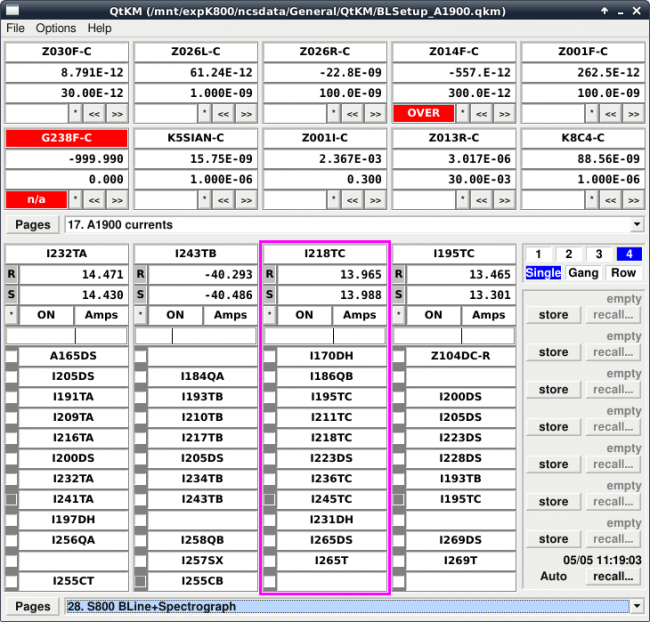
- Open the NCS application QtKM in the Applications Menu. Open file BLSetup_A1900.gkm. The magnetic elements that are typically tweaked with the knob box sitting on the left side of u6pc5 are I232TA, I236TC, and I245TC which can be found on page S800 BLine+Spectrograph. Other elements used to improve the focusing in the object point, and the transmission are I172QA and I174QB. The goal of the dispersion-matching tuning is to find a compromise between transmission and resolution.
- The two figures below show the spectrum CRDC1.XG!FOI-AFP-BFP before (top) and after (bottom) the dispersion-matching tuning for a typical experiment. Be aware that the width given by SpecTcl for the selected peak is not too reliable. It is more convenient to do a real gaussian fit.
Reaction Setting
Setting up Reaction Settings
- Calculating reaction setting
- Center unreacted beam at S800 FP
- Adjust spectrograph Brho to center beam at S800 FP
- Requirements for a beam to be “Centered”
- Spectrograph dipoles matched
- Beam position within about 1 cm of center as judges by 0 point on crdc1x spectrum or on track.xfp spectrum
- Record run to disk to document centered unreacted beam setting
- Calculate reaction setting using “effective” beam energy and the nominal target thickness
- Ideally, experimenters should be the ones making this calculation
- This approach assumes that the target thickness is known
- Reaction setting to FP
- Start with Attenuator setting of unreacted beam and step up in intensity
- If necessary, set up beam blocker looking at CRDC1.RAWS and/or CRDC2.RAWS SpecTcl spectra (see S800_CRDCS.win SpecTcl window shown above)
- Click on label I255 Slits in the S3 page of Barney
- Expected “open” values for top and bottom slits are CT ~6.8 and CB ~3.2, respectively
- Expect to see unreacted beam if reaction setting is within +/- 3% of unreacted beam setting
- Should have to move only one of the two blockers unless charge states are present
- Try to cut only as much as necessary; depends on
- What rate limits allow
- What experimenters want (e.g., if they want singles, the cut has to be more restrictive to limit acquisition deadtime)
- Move blocker, decrease attenuator, repeat
- If necessary, do the ToF corrections to improve the PID resolution (instructions here)
Coincidences
- Overview
- Most experiments at the S800 involve setting up an auxiliary detector system (e.g. SeGA, HiRA, etc) to be used in coincidence with the standard detectors of the S800.
- The auxiliary detector provides a secondary trigger that is fed into the S800 trigger system
- A key part of setting up the S800 for such experiments is getting proper timing setup between the S800 and any auxiliary detectors
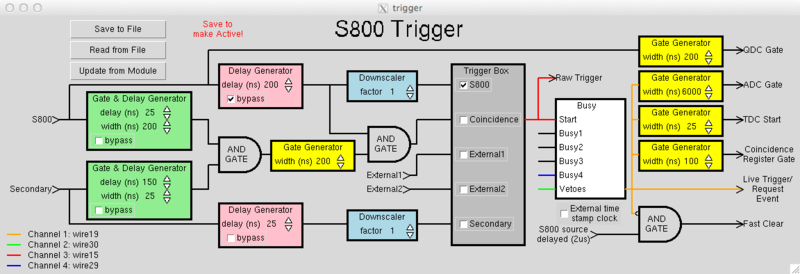
- For cases where the Secondary detector has a slow response relative to the S800, the coincidence timing must be reset to the S800 timing by delaying the S800 trigger using the third gate and delay generator on the trigger GUI
- A typical S800 delay for SeGA is 450 ns
- Probably smaller typical S800 delay needed for HiRA
- An example of experiments where auxiliary detectors are not used and, thus, setting up coincidence timing is not an issue are the experiments with tritons run by the charge exchange group
- Choice of setting to be used for coincidence timing setup
- The reaction of interest for the experiment can be used to setup coincidences only if the rate of coincidences is high enough
- Sometime the pilot beam is used for setting up the coincidence timing in cases where the intensity of the secondary beam is too small
- Example: Reaction of interest 2p knockout to make Mg-36 from Si-38 (Si-38 rate was 1000 pps)
- Setup
- Using the trigger GUI, select (right-click) the wires going into the first AND GATE (see figure below) from the “S800” and “Secondary” (after passing through their respective “Gate & Delay Generators”)
- Assign each wire to an inspect channel from the patch panel so that you can check their timings in the oscilloscope
- Adjust the width of the early signal (S800 or secondary) should be wide enough to catch coincidences with the late signal (width of late signal is not critical)
- Readjust TDC delays based on changes made to S800 trigger delay
- Experimenters will need to adjust their delays based on delay made to S800 trigger
- Have experimenters record a run with coincidences on their account
- S800 trigger TDC channel should show a peak (which corresponds to coincidences)
- “secondary” TDC channel should have a peak
- This check is required for verification in cases of low beam intensity (e.g. 1000 pps)
- Length of run required is typically about 10-15 minutes
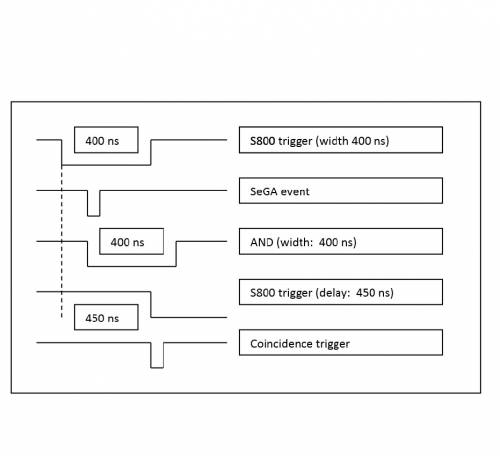
- Sample timing for running S800 with SeGA
- SeGA trigger is late with respect to S800 trigger
- The figure below represents a timing schematic to show how to
- Setup of the S800 trigger to recover timing needed for proper functioning of S800 FP detectors
- Set up the coincidence trigger
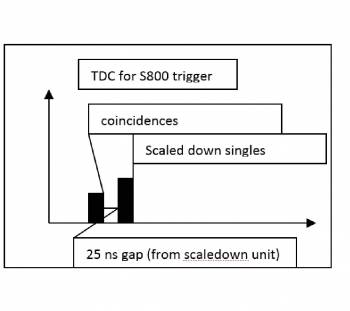
- A double peak structure will appear in the TDC for the S800 trigger between the coincidence events and the singles events (see figure below); the groups are separated by 25 ns because of the delay introduced by the downscaler used for the singles

